
Understanding Hypothesis Testing
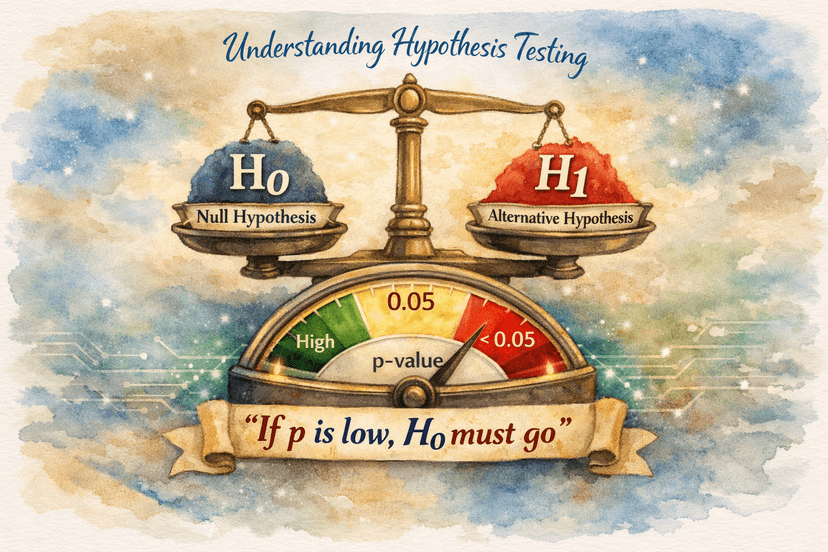
Understanding Hypothesis Testing: Why "If p is Low, H₀ Must Go"
"If p is low, H₀ must go." This well-known phrase summarises the core decision rule in hypothesis testing. But it took me a long time to truly understand why hypothesis testing exists in the first place. After all, if the average of a metric is different, doesn't that automatically mean the data comes from a different source?
Not necessarily, and the reason lies in the relationship between a sample and a population.
Population vs. Sample
When we conduct a census, we look at every unit in a population. This gives us complete information and allows us to compute the true population mean directly.
Sampling is different. When we draw a sample, we no longer observe the entire population, we only observe a subset. We are now trying to infer the properties of the whole population from limited data. Because samples vary naturally, we should expect sample means to differ from the true population mean, and from each other, purely by chance.
A Simple Example
Consider a small population defined by the values:
3, 4, 4, 6, 6, 5, 5, 4, 3, 6, 7
The population mean is 5.3.
Now imagine taking two random samples (each of size 4) from this population:
- Sample 1: 3, 4, 4, 5, 6 → mean = 4.4
- Sample 2: 3, 4, 4, 4, 3 → mean = 3.6
Both samples undeniably came from the same population, yet their means are quite different. If all we had were the sample values, without seeing the population, could we conclude whether they originated from the same underlying source?
This is precisely the problem hypothesis testing is designed to solve.
Why Hypothesis Testing Matters
In real-world scenarios, especially in manufacturing where samples are large, noisy, and constantly collected, we need a systematic way to determine whether differences we observe are due to:
- Random sampling variation, or
- A genuine difference between populations (e.g., a shift in a process, a change in material, a new operator effect)
Hypothesis testing provides a formal framework to make this decision.
The Hypotheses
We always define two competing statements:
- Null Hypothesis (H₀): Assumes no difference, no effect, and no meaningful relationship. In other words, any observed difference is just sampling variation.
- Alternative Hypothesis (H₁): Suggests a significant difference or relationship exists.
The Significance Level and the p-Value
Before analysing the data, we choose a significance level, commonly 0.05. This is the threshold at which we decide that evidence against the null hypothesis is strong enough.
The analysis then produces a p-value, which represents the probability of obtaining results at least as extreme as those observed if the null hypothesis were true.
The decision rule is simple:
- If p-value ≥ significance level, we fail to reject H₀ (the evidence is not strong enough—differences may be due to chance).
- If p-value < significance level, we reject H₀ in favour of H₁ (the observed difference is unlikely to be explained by random sampling alone).
This does not prove the null hypothesis false, but it indicates that the observed difference is unlikely to be explained by random sampling alone. More on possible errors in the coming weeks.